Configuring Dashboard Settings
On the Settings page, dashboard owners and Organization Administrators can configure general dashboard settings, add or modify dashboard variables, and edit the JSON Model of the dashboard.
To access dashboard settings:
-
Navigate to Dashboard > Library.
-
Locate and click the dashboard whose settings you want to configure.
-
Click Edit > Dashboard Settings (
 ).
).
Configuring General Settings
On the General tab of the dashboard settings, you can take the following actions:
-
Modify the dashboard name and description
-
Add or remove tags
-
Speed up dashboard load
-
Enable or disable content view
-
Define dashboard permissions
-
Select which user roles can access the dashboards and define their permissions or make the dashboard private. For more details on dashboard permissions, refer to Managing Custom Dashboard Permissions.
Note: To learn more about user roles, refer to Managing Roles. -
Define auto-refresh intervals
-
Hide or unhide the time picker
-
Enable or disable time picker for each panel
-
Delete the dashboard
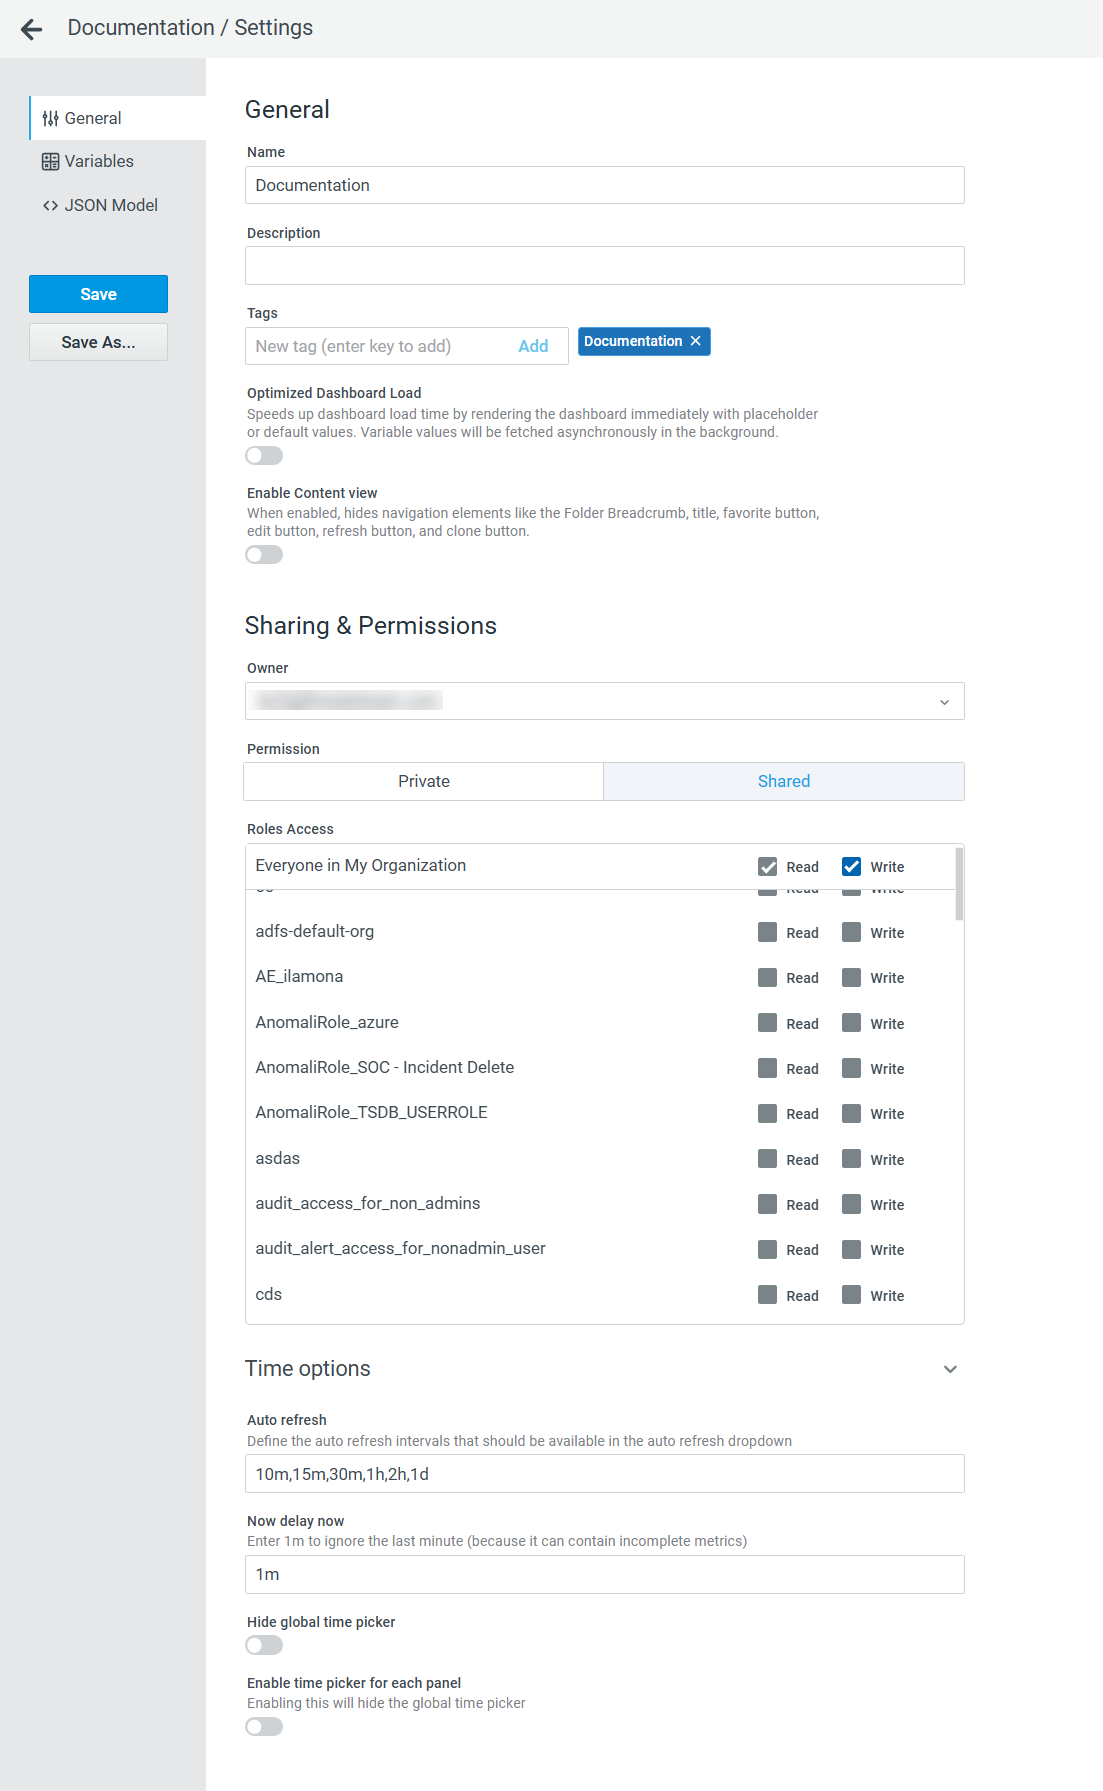
To configure general dashboard settings:
-
Click Edit > Dashboard Settings (
) on the dashboard. -
Make the required changes.
-
Click Save Dashboard to save the dashboard changes.
Click Save As to create a new dashboard based on the configured dashboard. You can modify the dashboard name, select a folder for storing the new dashboard, and copy tags, if necessary.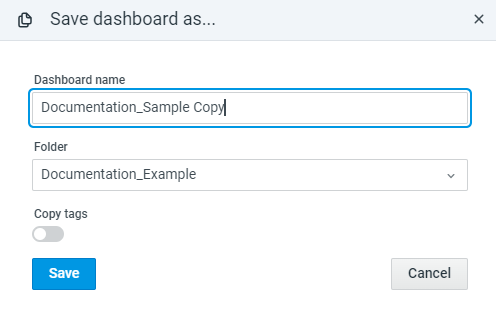
-
Reload the changes for the dashboard to take effect.
Adding Dashboard Variables
Variables enable more interactive and dynamic dashboards. Instead of hard-coding things like server or sensor names in your metric queries, you can use variables in their place. Variables are displayed at the top of the dashboard, making it easy to change the data displayed on your dashboard.
To add a dashboard variable:
-
Click Edit > Dashboard Settings (
) on the dashboard. -
Click the Variables tab.
-
Click Add variable.
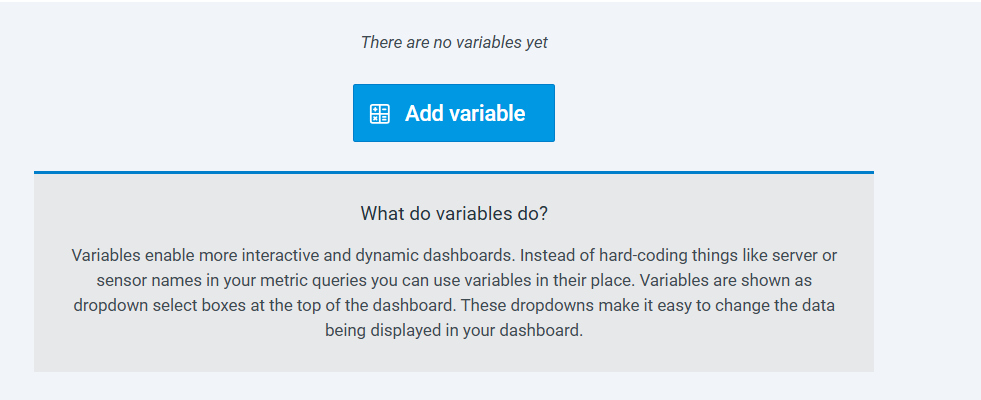
-
Configure the variable settings.
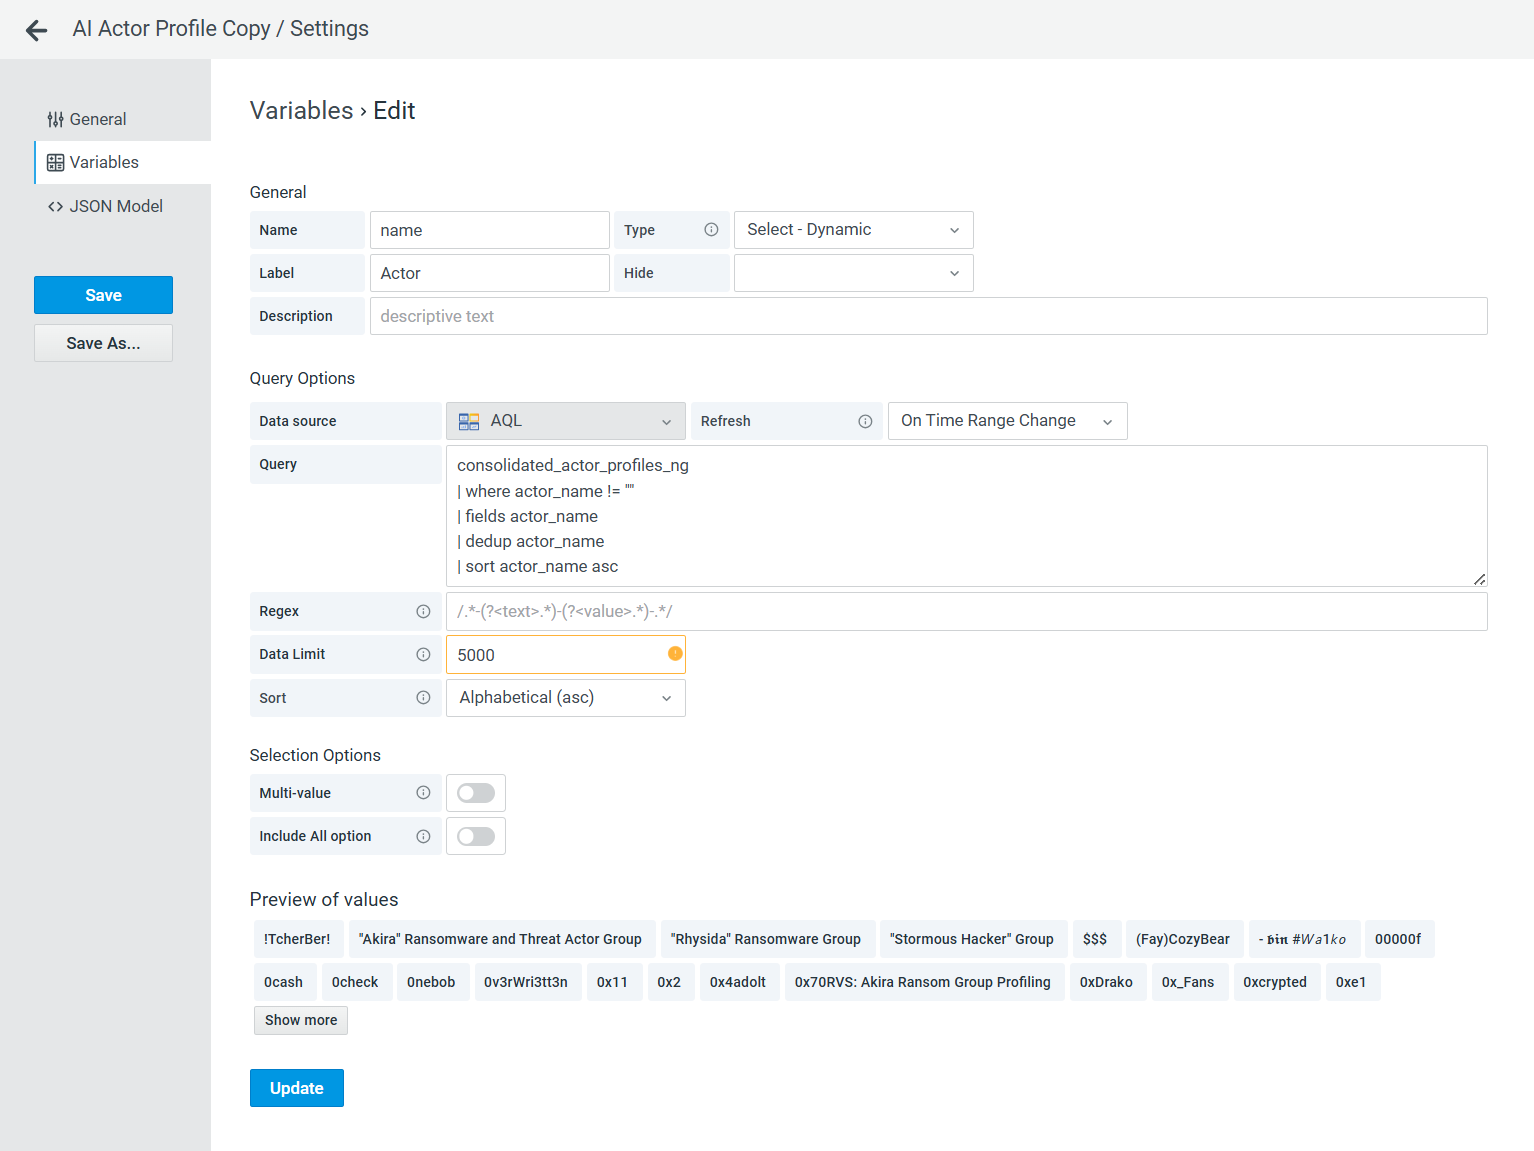
-
Click Update.
-
Click Save Dashboard.
Note: By default, the dashboard dropdown displays 100 results. You can increase this limit up to 5,000, but you may encounter longer loading times and overall slower performance.
The new variable appears at the top of the dashboard.
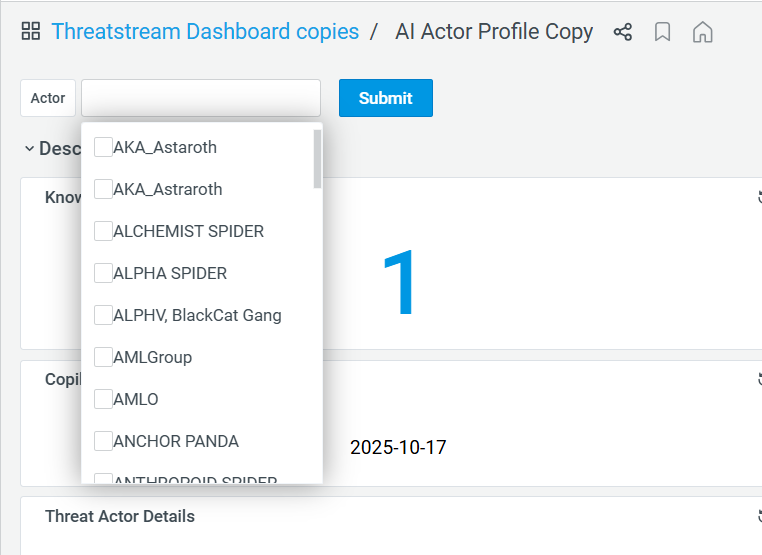
All created variables can also be found on the Variables tab of the dashboard Settings page.
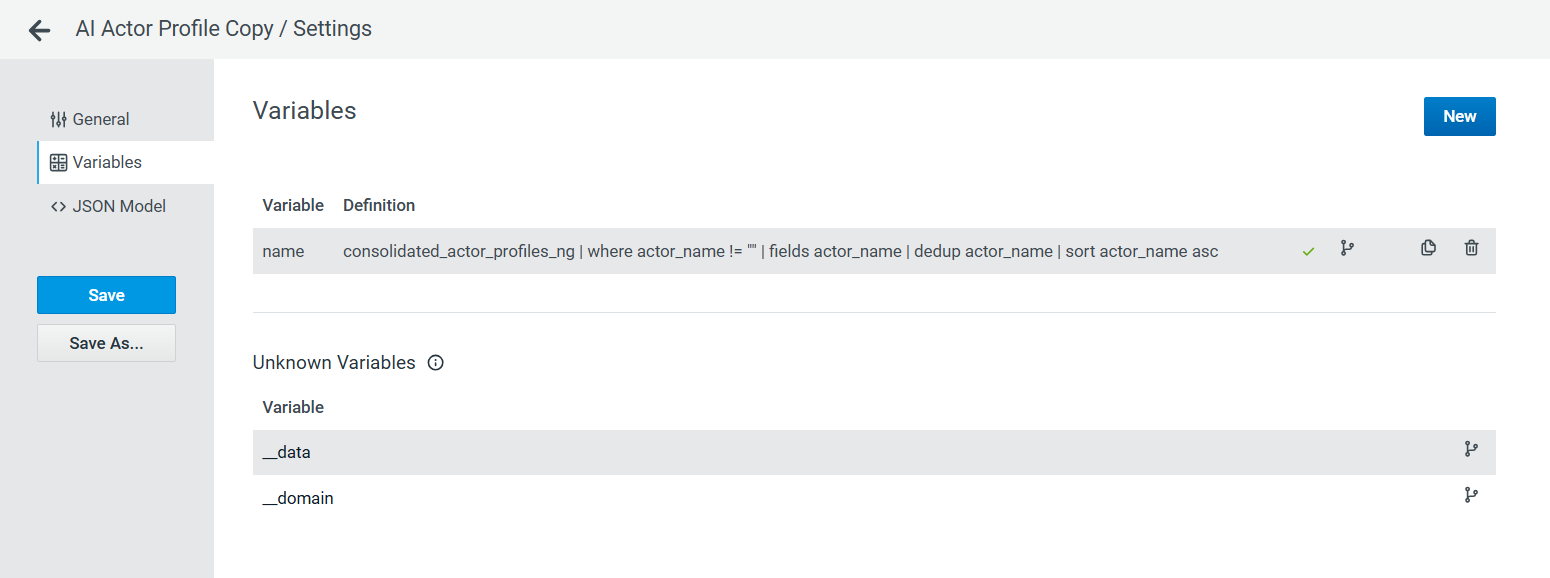
On the Variables tab, you can apply the following actions to variables:
-
Configure variable settings by clicking on the variable of interest
-
View variable usage by hovering your mouse over the merged branch (
 ) icon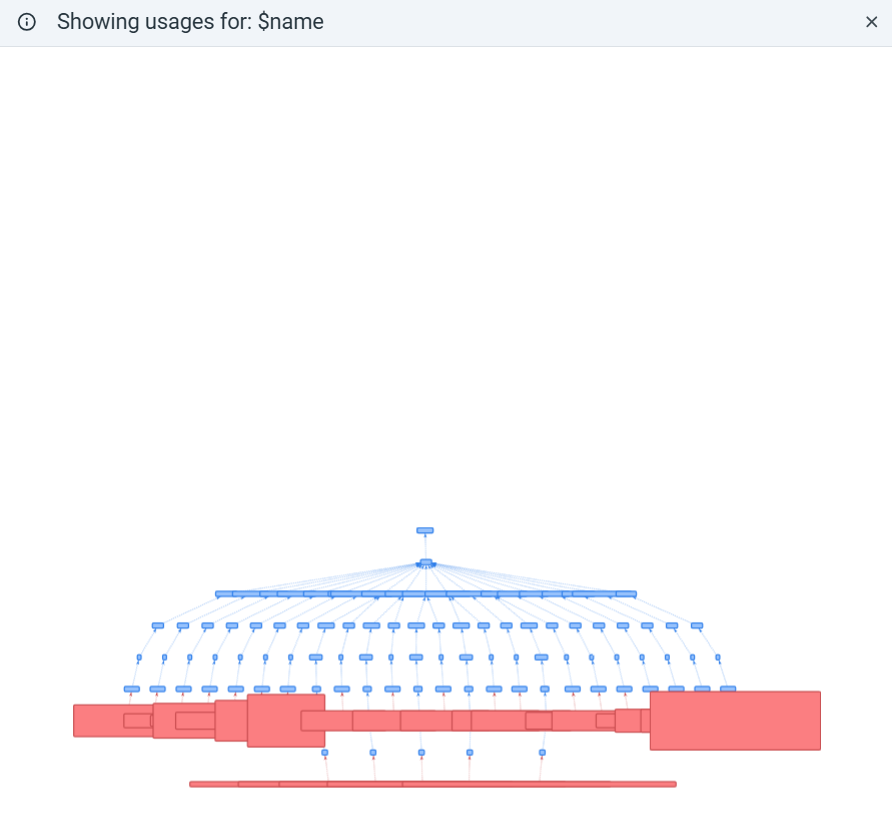
-
Re-arrange the order in which the variables are displayed on the dashboard by using the up (
 ) and down (
 ) arrows.
 -
Duplicate variables by clicking the duplicate (
 ) icon.
 -
Delete variables by clicking the delete (
 ) icon.
 -
Create a new variable by clicking New.
Configuring JSON Model
To configure the dashboard JSON Model:
-
Click Edit > Dashboard Settings (
) on the dashboard. -
Click the < > JSON Model tab.
-
Make the required changes in the objects, and click Save Changes.
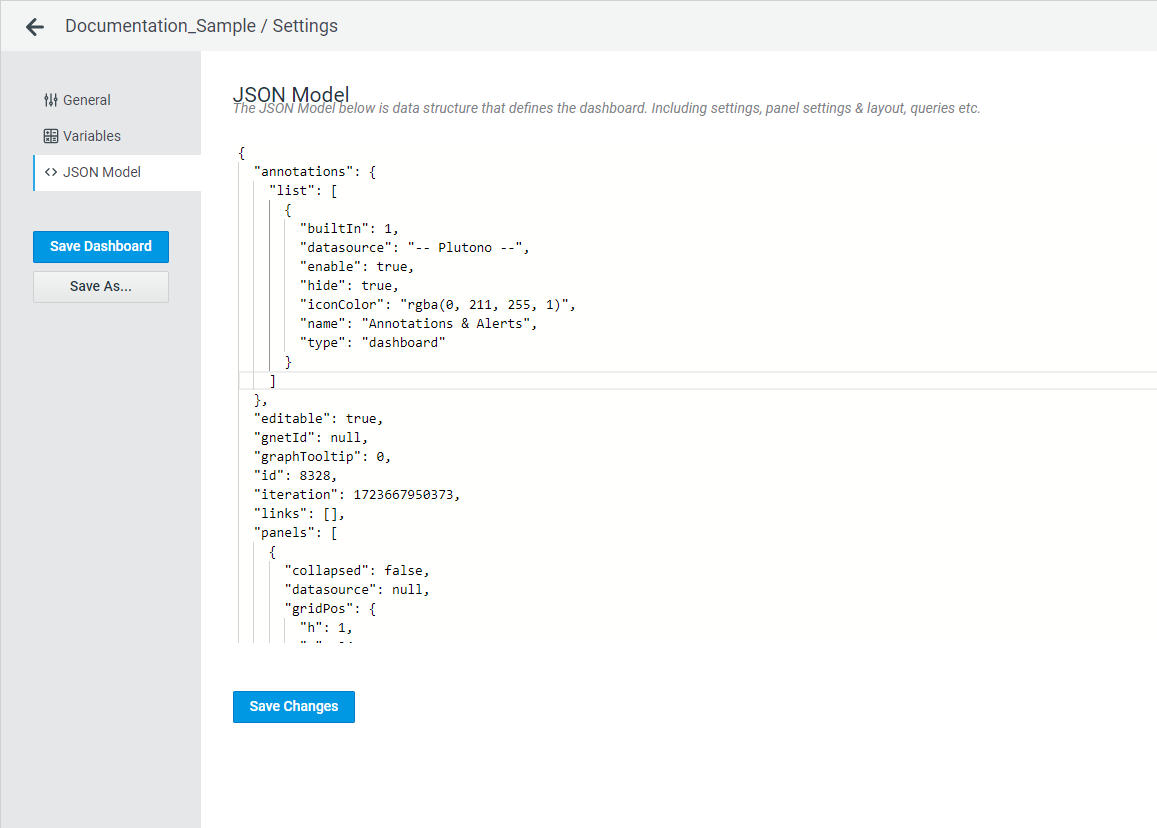
After configuring the dashboard JSON Model, click Save Dashboard to save the changes.
Click Save As to create a new dashboard based on the configured JSON Model. You can modify the dashboard name, select a folder for storing the new dashboard, and copy tags, if necessary.
Configuring Variable and Panel Dependencies
On the < > JSON Model tab of the Settings page, you can configure variable and panel dependencies. For example, you can define which Sweep Type options to display if Sweep Selector is set to Sweep Select.

Variables can also help you improve dashboard data visibility by allowing you to show or hide panels based on variable options specified in panel dependencies.
To configure variable dependencies:
-
Click Edit > Dashboard Settings (
) on the dashboard. -
Click the < > JSON Model tab.
-
In the
templatingobject of the dashboard JSON Model, add thedependsproperty to the variable definition to configure dependencies.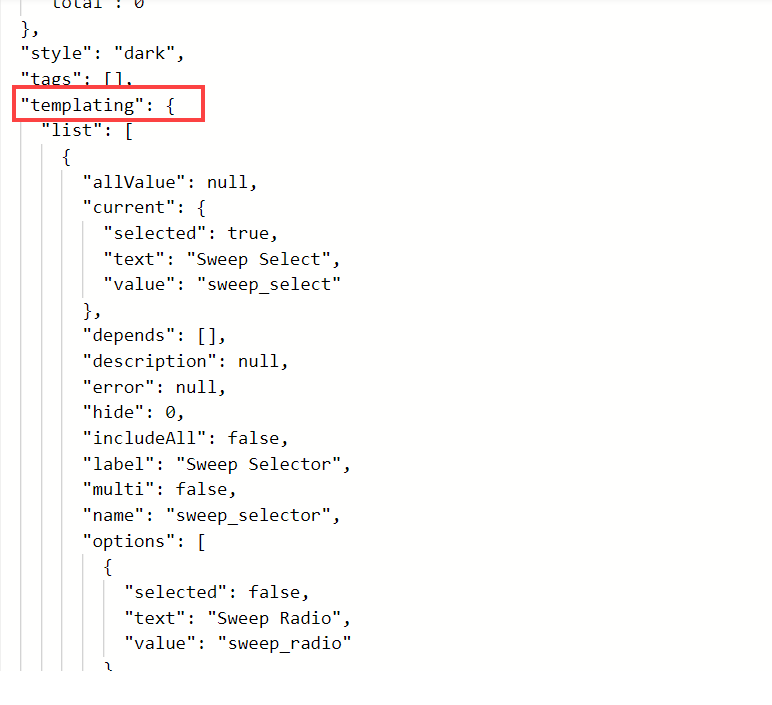
-
Configure dependencies of all variables.
-
Click Save Changes.
To show/hide a panel:
-
Click Edit > Dashboard Settings (
) on the dashboard. -
Click the < > JSON Model tab.
-
In the
panelsobject of the dashboard JSON Model, locate the panel whose visibility you want to configure. -
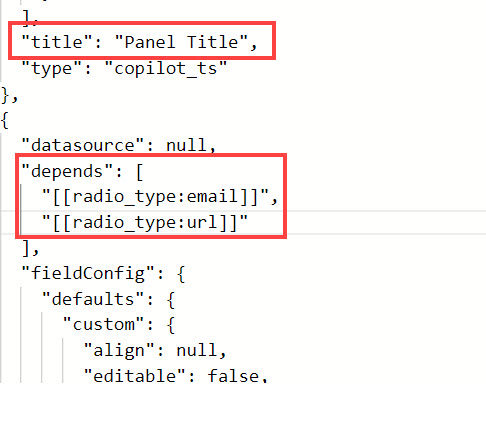
In the
dependsproperty, list all variable options that, if selected, will make the panel visible.
For example, the image below demonstrates that the Panel Title panel is visible only when theradio_typevariable is set toemailorurl. This means that when other variable options are selected, the panel will be hidden on the dashboard.If dependencies are not specified, the panel will always be visible.
-
Click Save Changes.